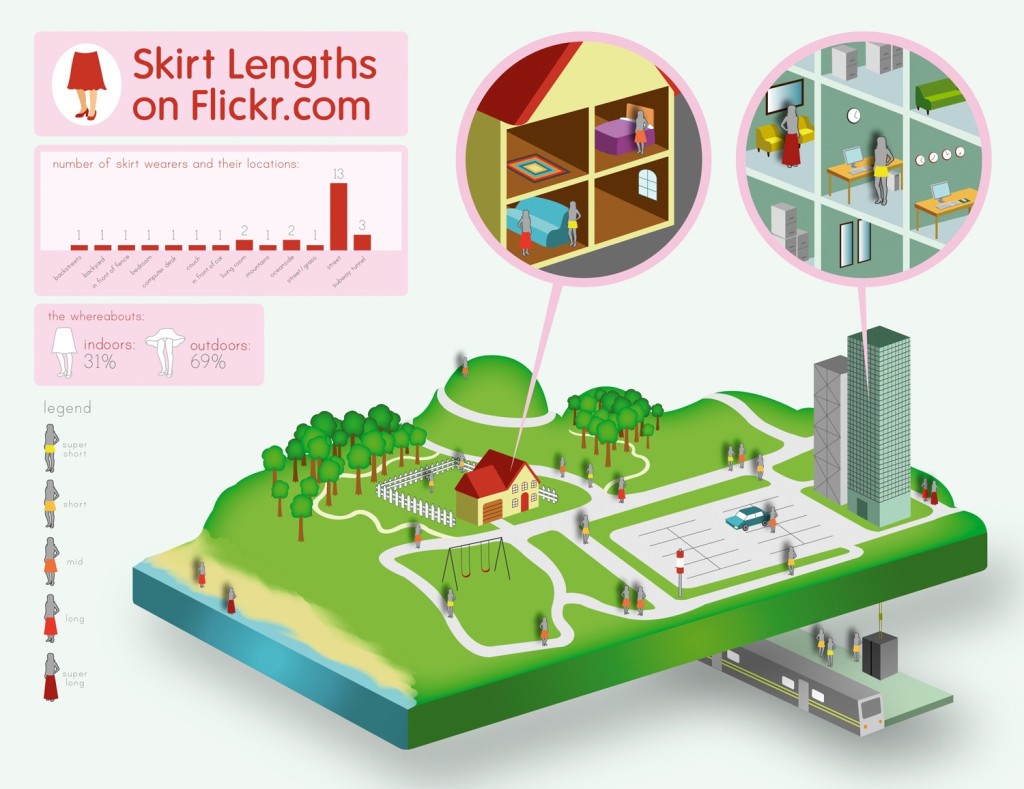
This is an infographic created using Adobe Illustrator. I found this infograph from a Adobe Illustrator tutorial website. This is definitely a very high-level difficulty work that requires lot of knowledge about the program to make it. However, if I were to guess what the designer have done to create this project, The first thing I can think of is setting up the three-dimension grid, based on the three dimensional rectangular platform. Also, one would have used the pen tool to create figures like houses, trees, train station, and the beach scene.
GRA 217 Section 5 Group 2
The official blog for GRA 217 with Sherri Taylor


This illustration contains a large amount of dimensionality. It’s interesting the way the information is portrayed through certain colors. Though at a glance it may seem like there isn’t much to see, the illustration is populated with many skirt-wearers, likely duplicated through holding control and dragging images around. The repetition of similar images is facilitated through illustrator, but should not discount the impressive detail of the illustration.
I really like this colorful info-graphic picture. We can see many details and information in it. I cannot surely know how to create this picture, but each figure was not hard to create. Hence, I think the figures were created firstly with a three-dimension grid, and then combined together.